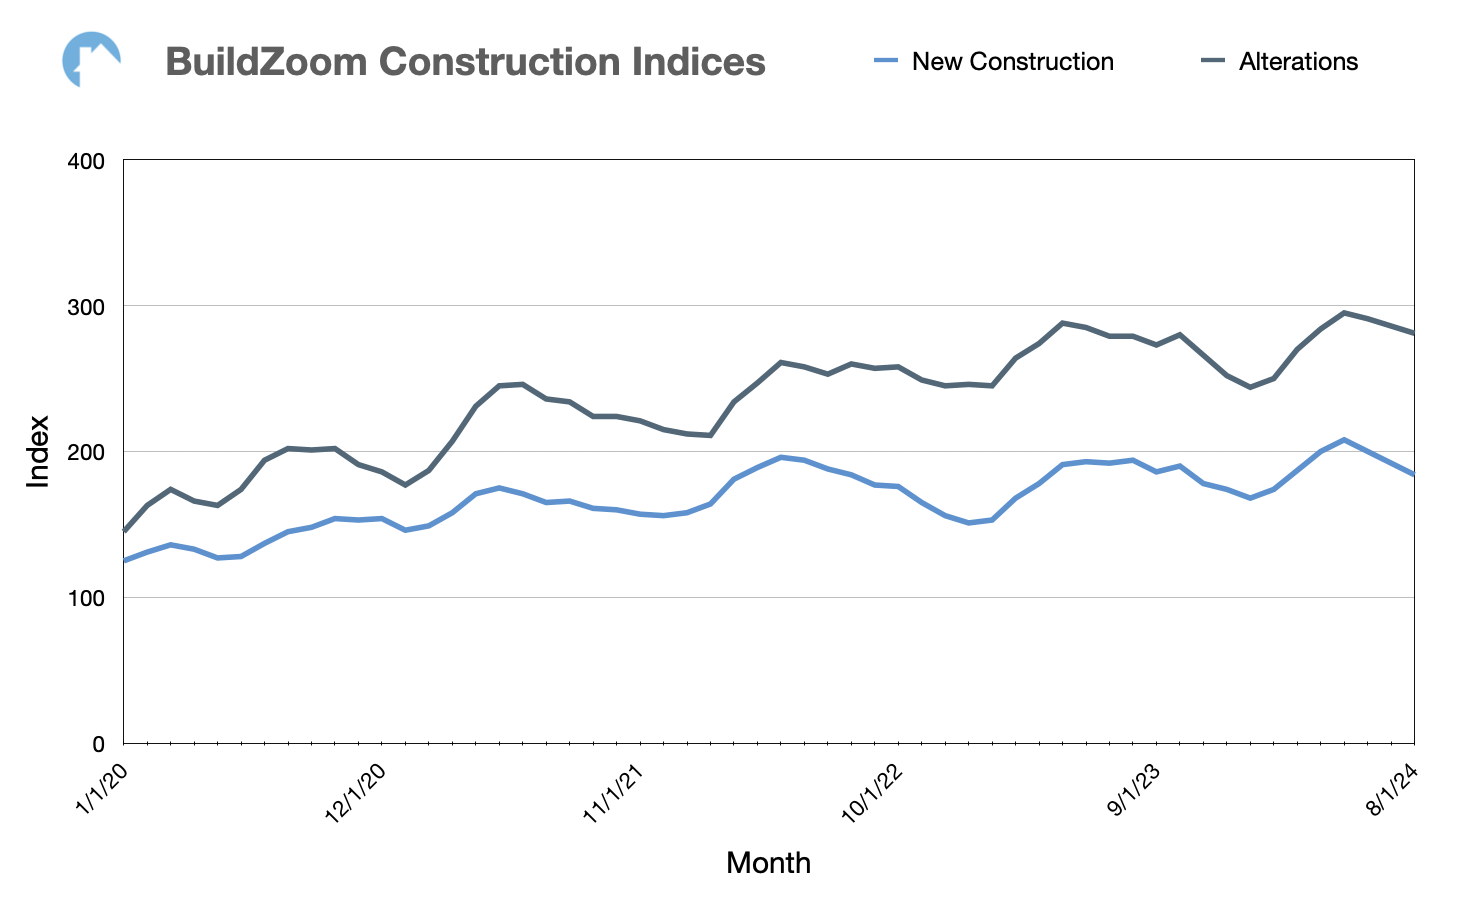
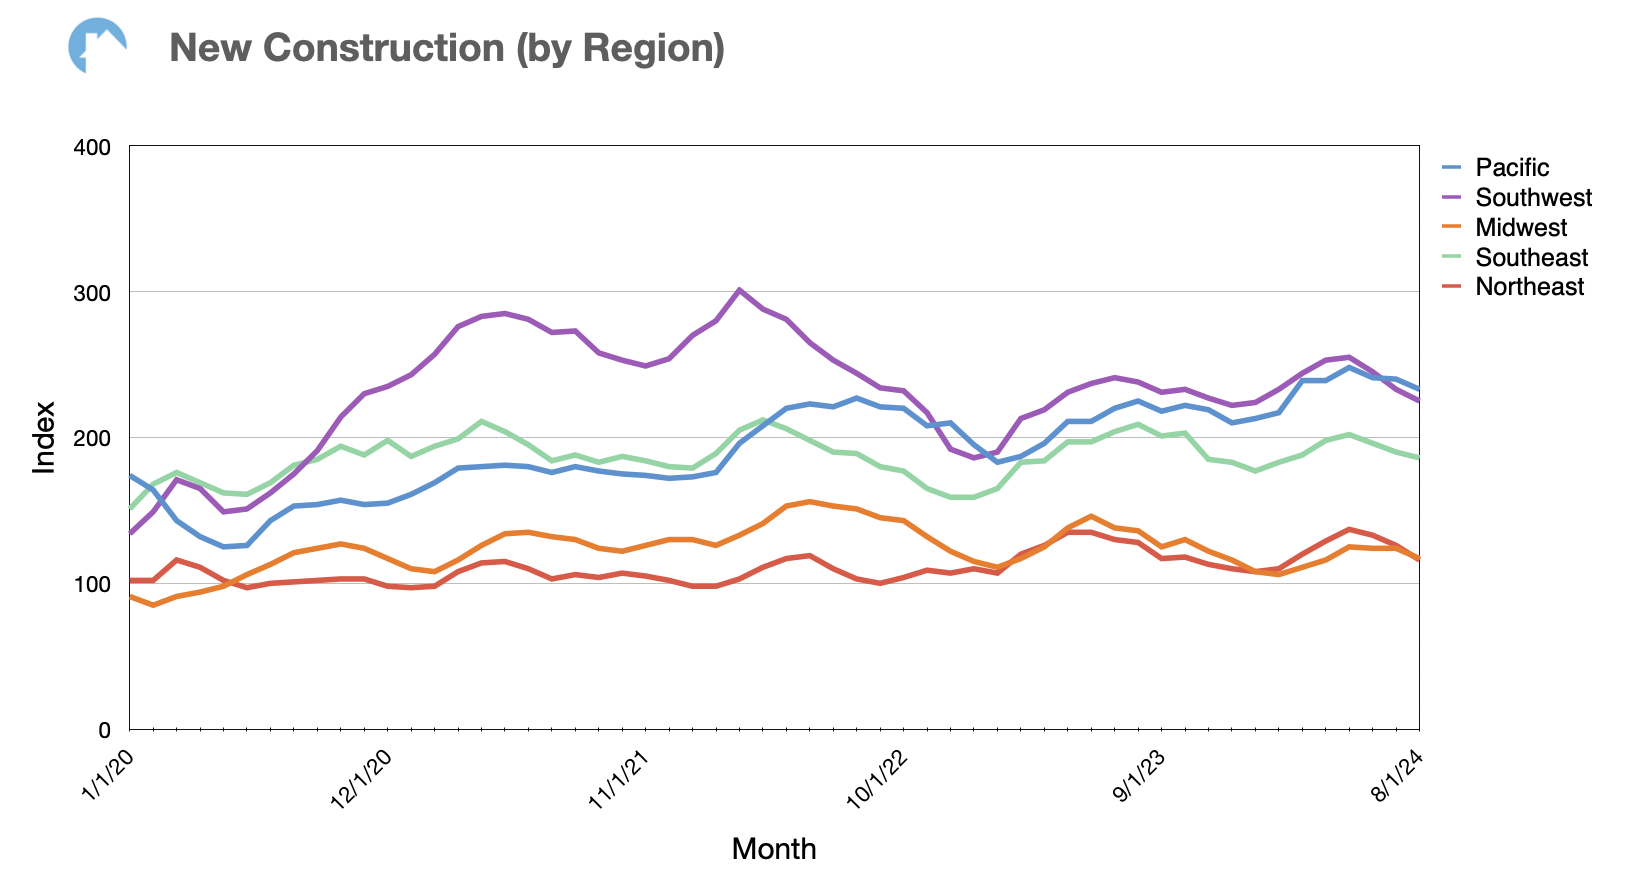
New construction activity for the US continued the pattern from July 2024 and decreased in August. This means a -5% change for new construction from a year-over-year point of view. Alteration activity also dipped again in August, although not as much in magnitude as new construction. For alterations, year-over-year growth remained positive at 1%.
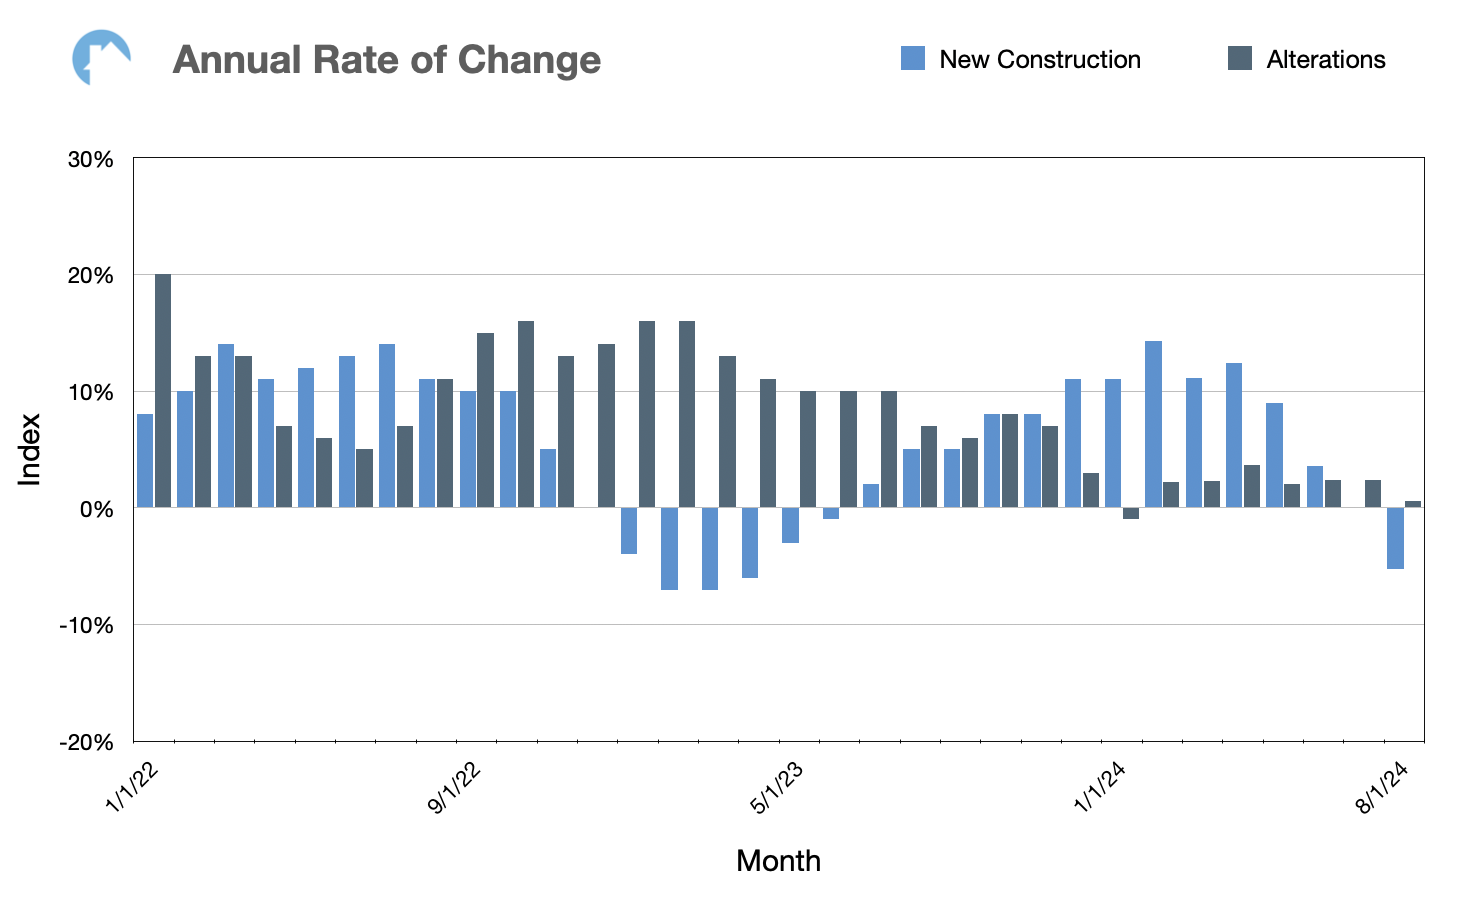
Regionally, similar to last month, the Pacific region was the only one with positive August year-over-year growth for new construction activity. The most significant annual decline in August permit activity occurred in the Midwest and Southeast.
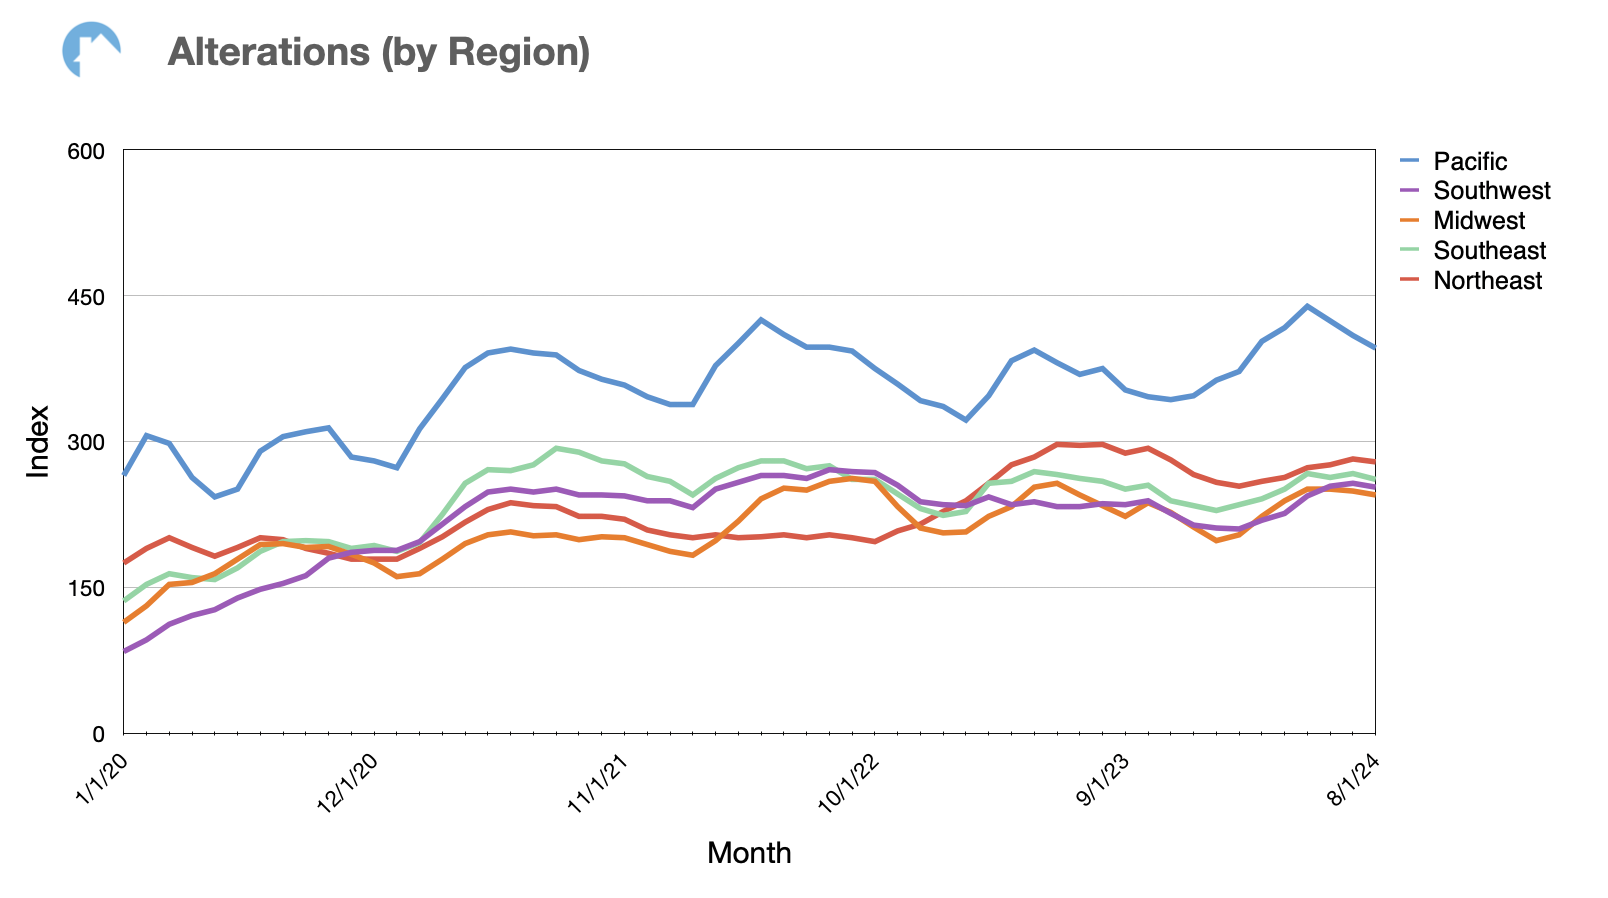
For alteration activity by region, the Pacific, Southwest, and Midwest markets were significant contributors to year-over-year growth. The Northeast continued to see negative year-over-year growth.
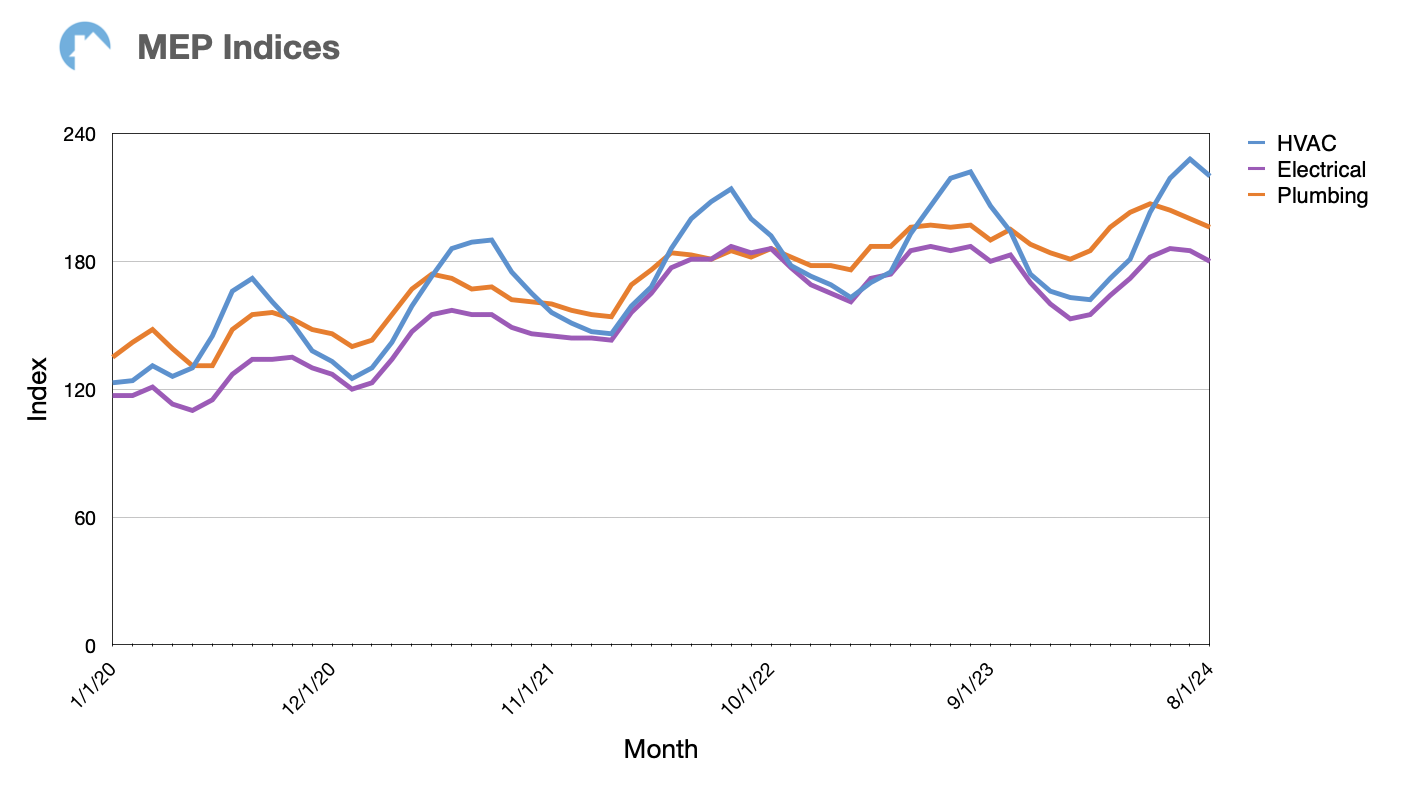
Year-over-year permit activity for National MEP (mechanical, electrical, and plumbing) together saw a slight average decline.
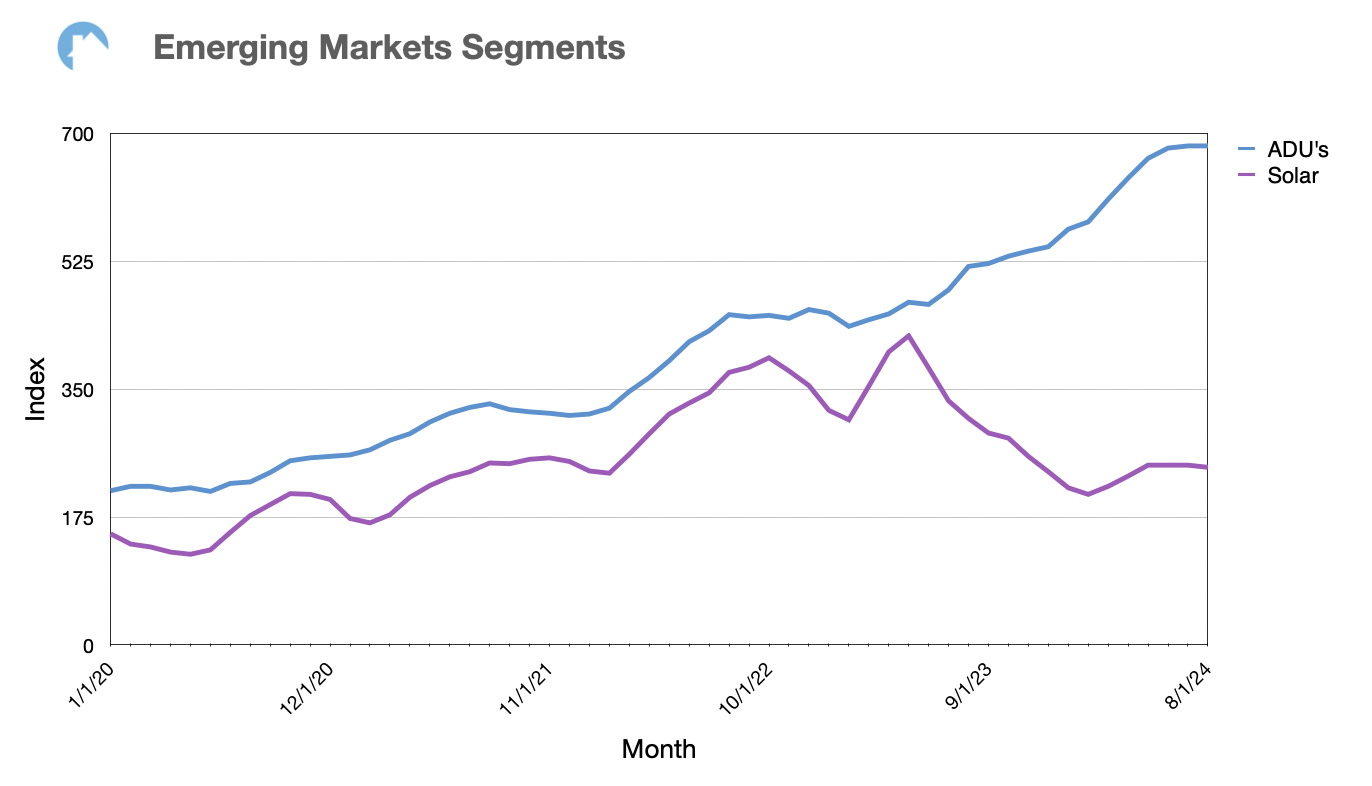
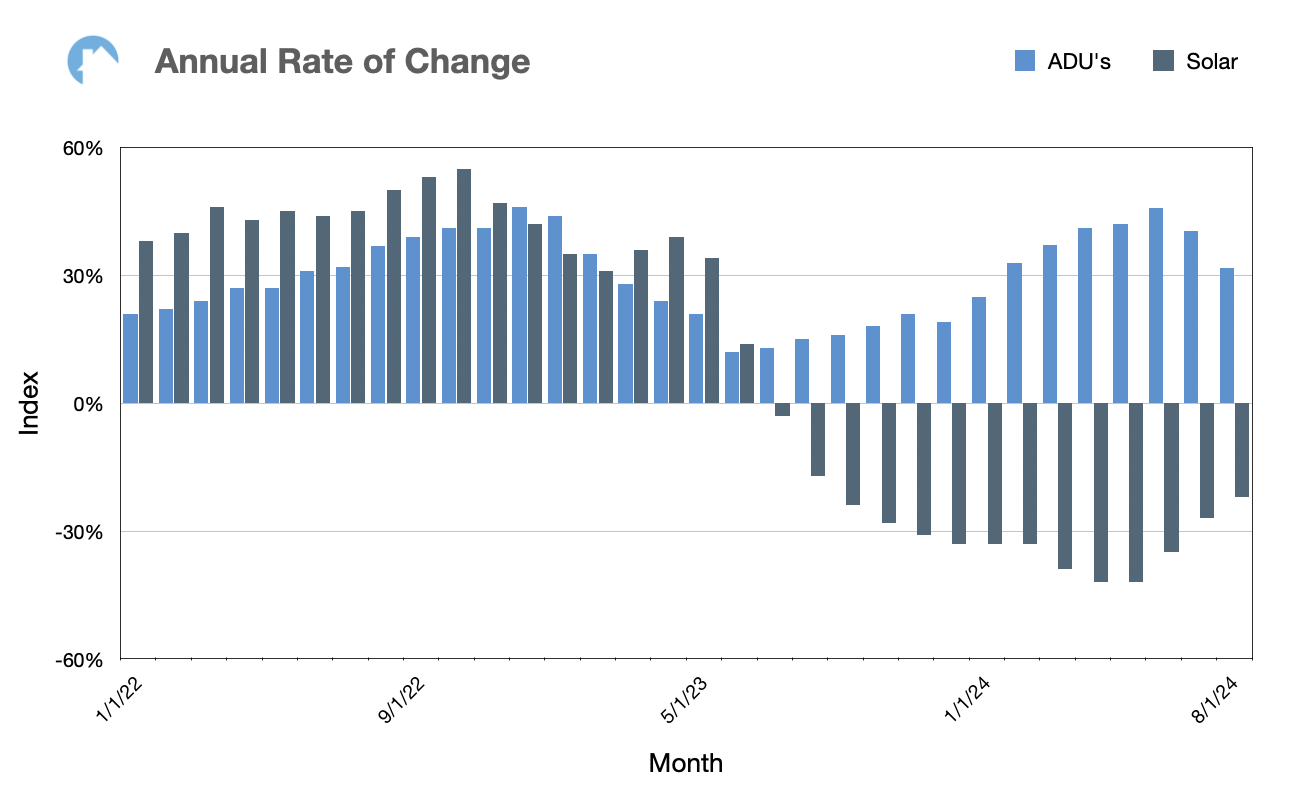
Permit activity for ADUs remained the same between July and August 2024 but still saw a positive increase over last year, with 32% growth. However, compared to previous months, the rate of growth is decreasing. For reference, year-over-year growth was 46% and 40% in June and July, respectively.
Solar installation activity decreased between July and August. Year-over-year growth was negative as well, though the extent of this year-over-year growth decline continues to slow down.
\

Leave a Reply